Monitoring a Raspberry Pi with Python, InfluxDB and Grafana
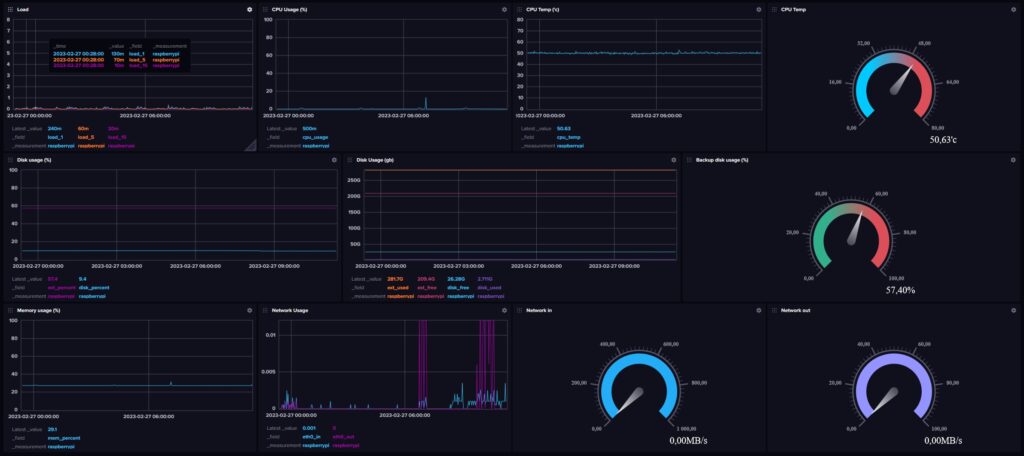
Inspired by this guide, I wrote this script to send system stats to InfluxDB 2.0 for a Pi that’s running as my off site backup server. More info about that project (with 3D printed case) in this article. While this is aimed at Raspberry Pi based systems, it should work on any other machine that runs a Debian based operating system.
Update 1: As part of this project to build a 1u Raspberry Pi enclosure, I have included a second script that includes libraries to read data from a DS18B20 temperature sensor that is connected to the 1-wire GPIO pin of the raspberry pi.
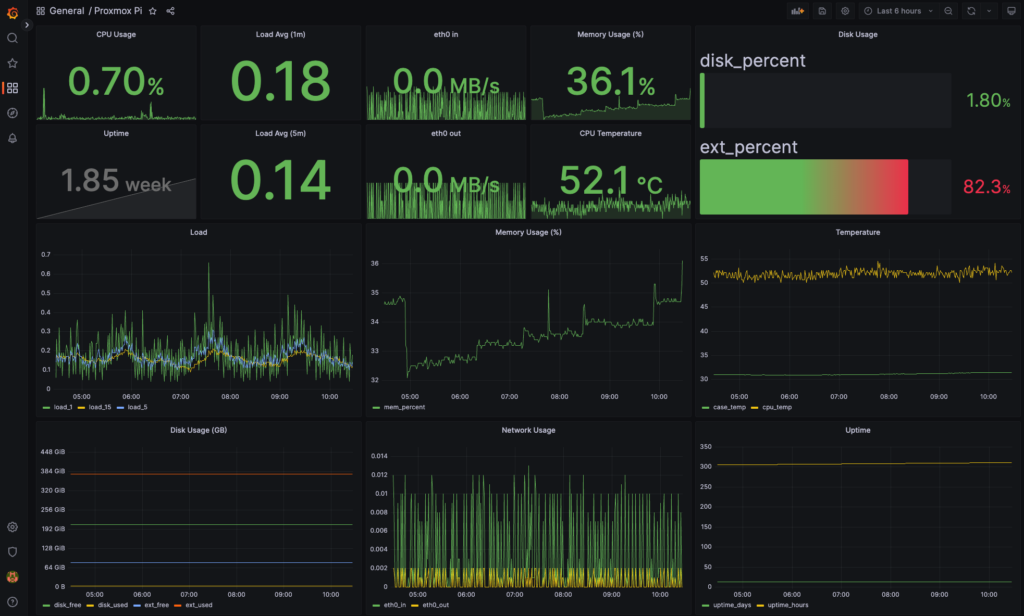
Update 2: I have added a Grafana dashboard template (.json file) to the GitHub repo because the InfluxDB dashboards can be a bit limited.
Github repo for this project: thatguy-za/rpi-stats-influxdbv2
Installation and setup guide
- Install Docker Engine (guide here)
- Install influxdb (I did this in docker – guide here) and setup an API token (guide here). Note: Influxdb only support 64bit operating systems.
- Run
sudo apt install -y python3-pipto install python and pip. - Run
sudo pip install psutil influxdb-clientto install the psutil library that we use to pull stats and the influxdb client to send the data to influxdb. - Download the pi_stats_influx.py script from my GitHub repo linked above
- Update the script with your influxdb details (API key, server connection details, etc).
- Run
crontab -eand add this script to run every minute by adding* * * * * python /home/pi/rpi-stats-influx.pyto the end of the file - Upload the dashboard_template.json file to influxdb so you have a basic dashboard to view metrics.
- Customise the graphs to suit your needs.
- Enjoy 😀


*The product links in this post may contain affiliate links. Any commission earned is used to keep the servers running and the gin cool.
Thanks for making it to the end of the post!


